
Vung Tau weather: warm all year, wetter from May
Vung Tau weather follows a simple pattern. Temperatures stay high in every month, so the main difference between seasons is rainfall. The table on this page comes from the Vietnamese construction ministry's climate standard QCVN 02:2022/BXD and uses the Vung Tau station. It lists historical monthly averages, not a forecast and not the measured values of any single year.
Use it to plan the shape of your trip, then check a forecast a few days before you travel. If your plans centre on the sand, read the Vung Tau beaches page next, and if you are choosing dates for a weekend, see where to stay for the crowd notes.
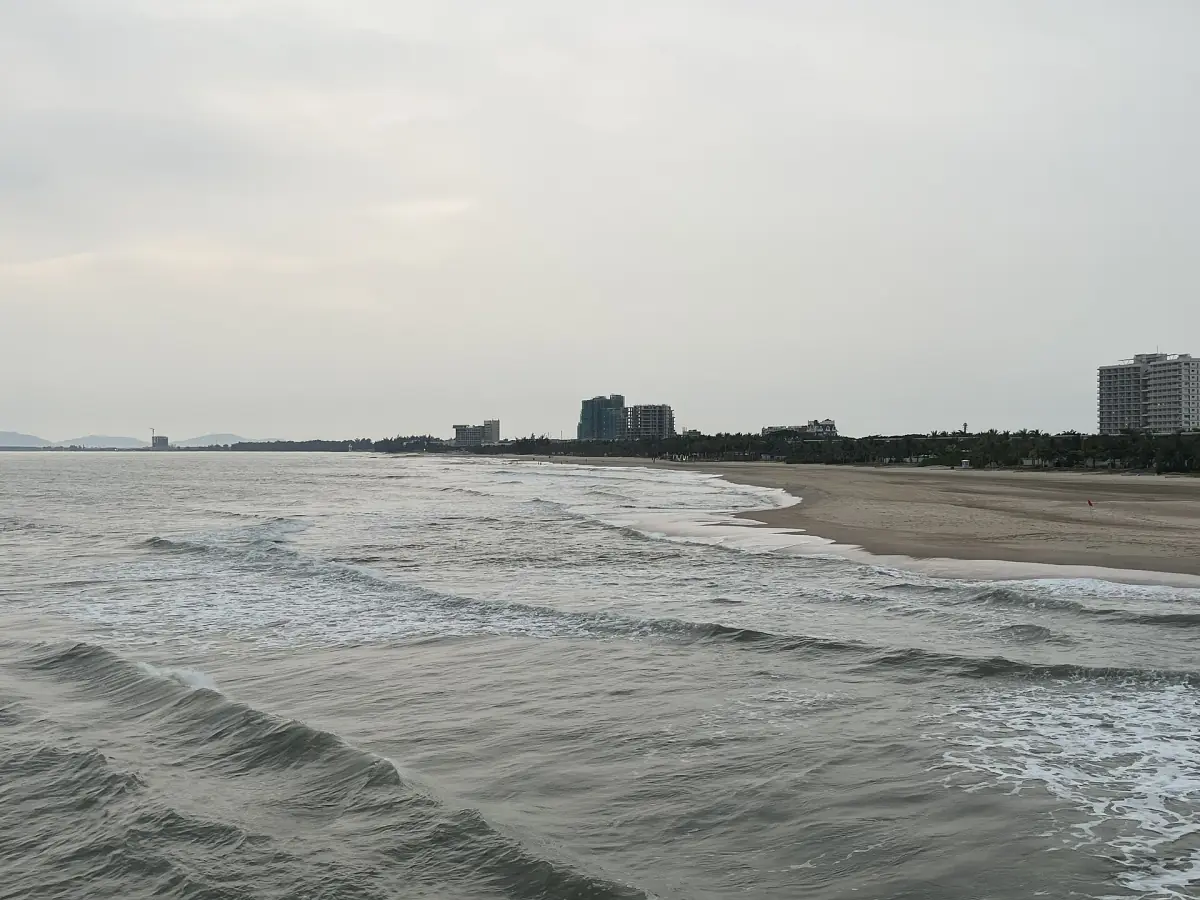
Our pick: a private beach tour
This private beach tour suits a dry day; around Lunar New Year the total price rises by 30 %.
Hand-picked tours, booked through GetYourGuide. Prices are indicative starting prices in US dollars (as of October 2026). Tap a tour for live availability and the current price in your currency.
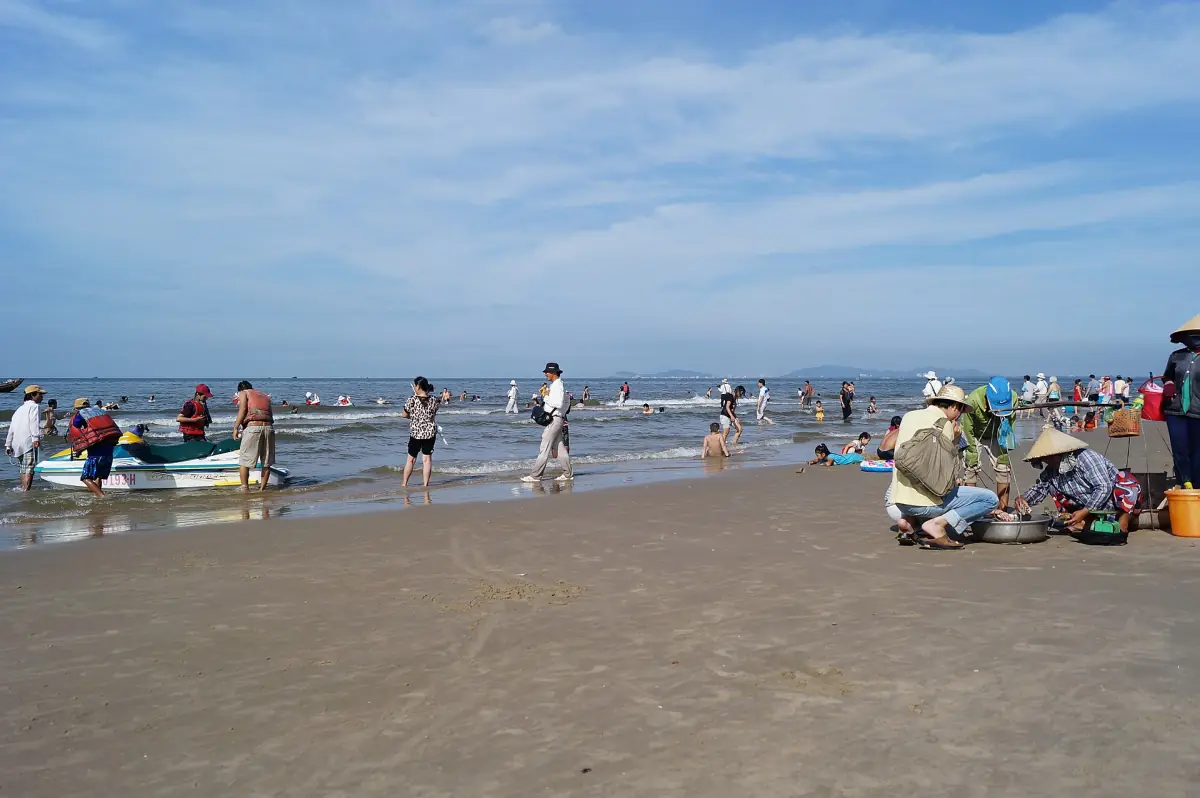
Beach and day tours around Vung Tau
A private beach tour from Phu My port and other Vung Tau day trips, with prices and availability updated live.
Vung Tau weather by month
Average daily high, average daily low and monthly rainfall at the Vung Tau station.
| Month | High (°C) | Low (°C) | Rain (mm) |
|---|---|---|---|
| January | 29.3 | 23.1 | 4.3 |
| February | 29.6 | 23.9 | 1.1 |
| March | 30.6 | 25.5 | 5.2 |
| April | 32.0 | 26.8 | 34.0 |
| May | 32.4 | 26.6 | 181.7 |
| June | 31.8 | 25.8 | 223.8 |
| July | 31.2 | 25.3 | 225.0 |
| August | 31.1 | 25.4 | 206.0 |
| September | 31.0 | 25.2 | 218.5 |
| October | 30.7 | 25.0 | 239.5 |
| November | 30.6 | 24.7 | 63.6 |
| December | 29.8 | 23.6 | 16.4 |
The highs and lows are averages of the daily maximum and minimum, not records. Treat the figures as a guide to the typical pattern.
Dry season, November to April
Reading the table, the drier half of the year runs from November to April. November still brings 63.6 mm, then December drops to 16.4 mm. January, February and March are the driest months, with 4.3, 1.1 and 5.2 mm, and April is the first month to pick up at 34.0 mm. This is our reading of the table, not an official visitor recommendation, and it does not promise calm seas or clear skies on a given day.
For a beach day, these months give you the best odds of dry weather. A private beach tour from Phu My port fits well with the drier months: it includes a private air-conditioned vehicle with port pickup and drop-off and bottled water, while the guide, entrance fees, lunch and the freshwater shower at Thuy Van Beach are extra. A 30 % surcharge applies during Lunar New Year.
Rainy season, May to October
Rain arrives in force in May, with 181.7 mm, and stays heavy through the following months: 223.8 mm in June, 225.0 in July, 206.0 in August, 218.5 in September and 239.5 in October, the wettest month in the table. Temperatures stay warm throughout these months. Pack a light rain jacket, plan indoor stops such as a museum visit, and keep your beach time flexible.
Vung Tau in December
A common month for planning a short escape.
December averages 29.8 °C for the daily high and 23.6 °C for the daily low, with 16.4 mm of rain. That is one of the cooler months in the table and sits well inside the drier half of the year. If you plan to walk the Front Beach promenade or climb to the statue, the Christ statue and lighthouse page explains the route.
Weekends and national days off
Weather is only one factor in how a day in Vung Tau feels. An official tourism post from June 2025 reported stronger demand around weekends and public days off, and a press report from early September 2026 described crowded beaches and heavy traffic. If you can choose, travel on a weekday and book rooms early for weekends.
Best time to visit Vung Tau
The best time to visit Vung Tau for beach weather is the drier half of the year from November to April, with January to March the driest of all. The wetter months are still workable if you accept some showers. Pick the season, then pick a weekday if you can, and check the forecast before the trip.
Vung Tau weather: frequently asked questions
What is the best month to visit Vung Tau?
For the least rain, January, February and March are the driest months in the table, with 4.3, 1.1 and 5.2 mm. The whole stretch from November to April is drier than the rest of the year.
When is the rainy season in Vung Tau?
The table shows heavy rain from May to October, with October the wettest at 239.5 mm.
How hot does Vung Tau get?
The average daily high is 32.4 °C in May, the highest in the table, and 29.3 °C in January. Nights stay mild throughout the year.
Is this a forecast?
No. The figures are historical monthly averages from the Vung Tau station. Check a current forecast before you travel.
What is the weather in Vung Tau in December?
December averages 29.8 °C for the high, 23.6 °C for the low and 16.4 mm of rain.